Plotly
Plotly express⚑
Usage⚑
Facet and Trellis Plots⚑
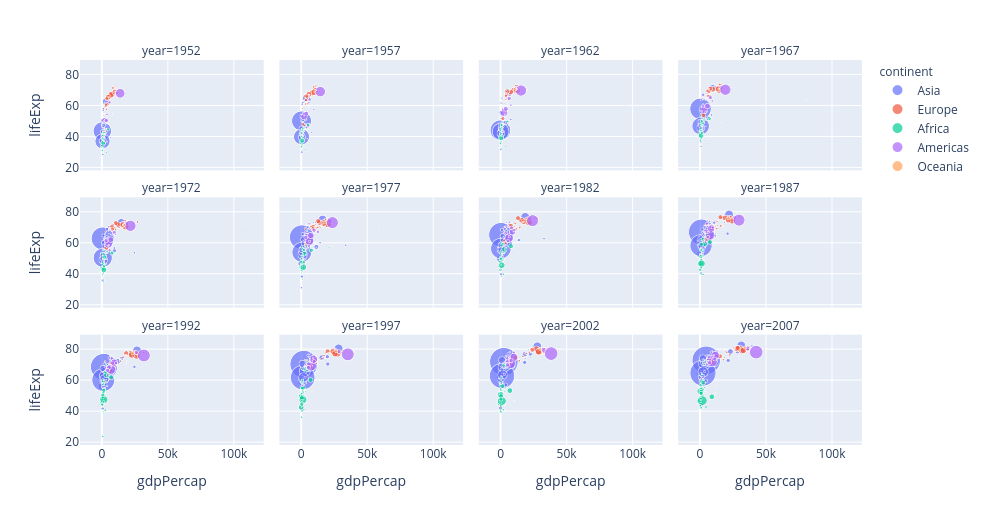
Facet plots, also known as trellis plots or small multiples, are figures made up of multiple subplots which have the same set of axes, where each subplot shows a subset of the data.
Example:
import plotly.express as px
df = px.data.gapminder()
fig = px.scatter(df, x='gdpPercap', y='lifeExp', color='continent', size='pop',
                facet_col='year', facet_col_wrap=4)
fig.show()
Convert Matplotlib figure to Plotly⚑
For better aesthetics and interactivity, you can convert Matplotlib figures, that often are returned by existing libraries, to Plotly with:
import plotly.tools as tls

x = np.random.random(100)  # toy data
y = np.random.random(100)  # toy data

## matplotlib fig
fig, axes = plt.subplots(2,1, figsize = (10,6))
axes[0].plot(x, label = 'x')
axes[1].scatter(x,y)

## convert and plot in plotly
tls.mpl_to_plotly(fig)
Dash⚑
Dash is a productive Python framework for building web analytic applications.
Configuration⚑
Reverse proxy⚑
There might be issues with the request URLs if the app is served under a non-root directory of a domain (e.g., domain.tld/dashboard/). This is because Dash uses some absolute paths by default.
Use the following configuration to avoid this issues:
app = dash.Dash(__name__)
app.config.update(
    {
        "routes_pathname_prefix": "", # default is /
        "requests_pathname_prefix": "/{path}/",
    }
)
Then if you use NGINX:
location /{path}/ {
        proxy_pass http://127.0.0.1:{binded_port}/;
}
Interactive visualizations⚑
The dash_core_components library includes a component called Graph.
Graph renders interactive data visualizations using the open source plotly.js JavaScript graphing library. plotly.js supports over 35 chart types and renders charts in both vector-quality SVG and high-performance WebGL.
The figure argument in the dash_core_components.Graph component is the same figure argument that is used by plotly.py.
Dash components are described declaratively by a set of attributes. All of these attributes can be updated by callback functions, but only a subset of these attributes are updated through user interaction, such as when you click on an option in a dcc.Dropdown component and the value property of tha component changes.
The dcc.Graph component has four attributes that can change through user-interaction: hoverData, clickData, selectedData, relayoutData.